Products
Leiden University's Centre for Science and Technology Studies (CWTS) offers a range of VOSviewer-based products. These products provide research institutions and research funders with a comprehensive view on their scientific activities, and they can serve as excellent tools to support strategic decision making. Some examples of VOSviewer-based analyses offered by CWTS are listed below.
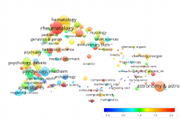 |
University profile mapsThese maps visualize the research profile of a university by showing how the output and impact of a university are distributed over scientific fields. In this way, universities' strengths and weaknesses can be identified and comparisons between universities can be made. |
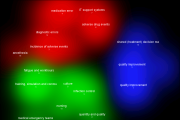 |
Disciplinary profile mapsA disciplinary profile map offers a breakdown of the scientific literature in a selected field into smaller research areas. Disciplinary profile maps have proven highly effective for visualizing the activity and impact of research groups and research institutes in specific areas of interest. |
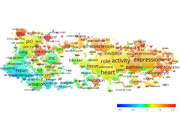 |
Citation density mapsCitation density maps use text mining techniques to provide an intuitive, easy-to-understand overview of a selected set of scientific publications, such as the set of all publications in a particular journal or field during a given time period. Colors are used to indicate the citation impact of different areas of research. This for instance makes it possible to easily identify hot research topics in the scientific literature. |
|
|
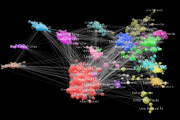
Collaboration mapsThese maps display collaborative relationships between universities, research groups, or individual scientists. Collaboration maps may for instance be used to reveal the main actors in a scientific collaboration network, and to see how different actors group together in different areas within a network. |
CWTS data infrastructure
The advanced data infrastructure of CWTS, and in particular the in-house availability of both Clarivate Analytics' Web of Science database and Elsevier's Scopus database, enables CWTS to create the above-mentioned maps based on massive amounts of bibliographic data, sometimes involving several millions of scientific publications. In addition to the maps mentioned above, CWTS also produces all kinds of customized maps based on special requests from clients. Do not hesitate to contact us if you want to know more about the possibilities we have.